What are double candlestick pattern?
Double Candlestick Pattern
Unlocking Profit Potential with The Double Candlestick Pattern.
Introduction:
In the world of financial trading, the ability to spot patterns and interpret them correctly can make a significant difference in one's success. One such pattern that has gained popularity among traders is the Double Candlestick Pattern. This pattern, characterized by its distinctive shape and formation, provides valuable insights into market sentiment and potential price reversals. In this article, we will explore the Double Candlestick Pattern and understand how it can be effectively used to enhance trading strategies.
Understanding the Double Candlestick Pattern:
The Double Candlestick Pattern is a technical analysis tool used by traders to identify potential trend reversals. It consists of two consecutive candlesticks with specific characteristics that provide clues about the future direction of an asset's price movement. This pattern can appear in both bullish and bearish trends and is commonly found on price charts of various financial instruments.
Bullish Double Candlestick Pattern:
The bullish Double Candlestick Pattern is recognized by two candlesticks appearing in sequence. The first candlestick is a bearish candle, indicating a downward movement in price. However, the second candlestick, which follows the bearish one, is a bullish candle that engulfs the previous bearish candle. This engulfing pattern signifies a shift in market sentiment, indicating potential upward momentum.
Bearish Double Candlestick Pattern:
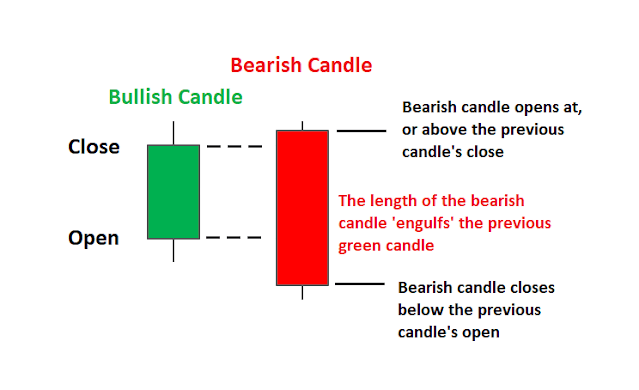
Conversely, the bearish Double Candlestick Pattern occurs when two candlesticks form in succession, but with opposite characteristics. The first candlestick is a bullish candle, indicating an upward movement in price. However, the second candlestick is a bearish candle that engulfs the preceding bullish candle. This engulfing pattern suggests a possible reversal in the prevailing trend, with downward momentum likely to follow.
Trading Strategies using the Double Candlestick Pattern:
Confirmation with Additional Indicators: While the Double Candlestick Pattern provides valuable information, it is advisable to confirm the signals it generates with other technical indicators or analysis tools. This can include trend lines, moving averages, or oscillators like the Relative Strength Index (RSI) or Moving Average Convergence Divergence (MACD).
Entry and Exit Points: Traders can utilize the Double Candlestick Pattern to determine entry and exit points for their trades. For instance, a bullish pattern may indicate a buy signal, while a bearish pattern may prompt a sell signal. It is crucial to wait for the confirmation of the pattern before executing a trade to minimize false signals.
Stop-loss and Take-profit Levels: Implementing appropriate risk management strategies is essential when trading based on the Double Candlestick Pattern. Placing stop-loss orders below the low of a bullish pattern or above the high of a bearish pattern can help limit potential losses. Similarly, identifying suitable take-profit levels based on support and resistance zones can assist in securing profits.
Conclusion: The Double Candlestick Pattern is a powerful tool that enables traders to identify potential trend reversals and capitalize on market opportunities. By mastering the interpretation of these patterns and combining them with other technical analysis tools, traders can enhance their decision-making processes and increase their chances of success. However, it is crucial to remember that no pattern guarantees accurate predictions, and risk management remains crucial in trading. As with any trading strategy, practice, discipline, and continuous learning are key to harnessing the potential of the Double Candlestick Pattern effectively.


